
Understand your SIP investments better! Learn to interpret your SIP graph, project future returns, and optimize your Systematic Investment Plan for maximum weal
Understand your SIP investments better! Learn to interpret your sip graph, project future returns, and optimize your Systematic Investment Plan for maximum wealth creation in Indian markets. Get insights on mutual funds, equity markets, and more.
SIP Graph: Visualize & Grow Your Investments in India
Demystifying the SIP: Your Gateway to Consistent Investing
In the dynamic world of Indian finance, navigating the complexities of investing can feel daunting. For many, especially those new to the stock market, the concept of lumpsum investments – putting a large sum of money at one go – can be intimidating due to the inherent risk of market volatility. This is where the Systematic Investment Plan (SIP) emerges as a powerful and accessible tool. Think of it as a disciplined and systematic way to build wealth over time.
A SIP, at its core, is a method of investing a fixed amount of money at regular intervals (typically monthly) into a chosen investment vehicle, most commonly mutual funds. This could be equity mutual funds, debt mutual funds, or even hybrid funds depending on your risk appetite and financial goals. Instead of timing the market, you’re dollar-cost averaging – buying more units when prices are low and fewer when prices are high. This strategy helps mitigate risk and potentially enhance returns over the long term.
The popularity of SIPs in India has surged in recent years, fueled by increasing financial literacy and the ease of access provided by online investment platforms. Data from the Association of Mutual Funds in India (AMFI) consistently shows a steady increase in SIP inflows, highlighting the growing trust and confidence Indian investors have in this investment approach. SIPs are particularly attractive for salaried individuals who can allocate a portion of their monthly income towards building a robust investment portfolio.
Why Track Your SIP? Beyond the Numbers
While the core concept of a SIP is straightforward, actively tracking its performance is crucial for making informed decisions and maximizing its potential. It’s not enough to simply start a SIP and forget about it. Regular monitoring allows you to understand how your investments are performing against your expectations and to make necessary adjustments along the way.
Here’s why keeping a close eye on your SIP is essential:
- Performance Evaluation: Tracking helps you assess whether your chosen mutual fund scheme is performing as expected. Are you meeting your return targets? If not, you might need to re-evaluate your fund selection.
- Risk Management: Market fluctuations are inevitable. Monitoring your SIP allows you to gauge the impact of market volatility on your investments and adjust your strategy accordingly. For instance, during a market downturn, you might consider increasing your SIP amount to take advantage of lower prices (a strategy known as “stepping up” your SIP).
- Goal Alignment: Your investment goals might evolve over time. Regular tracking ensures that your SIP remains aligned with your current financial objectives. Perhaps you initially started a SIP for retirement, but now you want to save for your child’s education. You might need to adjust your investment strategy to reflect this change.
- Portfolio Diversification: Tracking your SIP alongside your other investments provides a holistic view of your overall portfolio. This helps you identify any gaps in diversification and ensure that your investments are spread across different asset classes.
The Power of Visuals: Understanding the SIP Graph
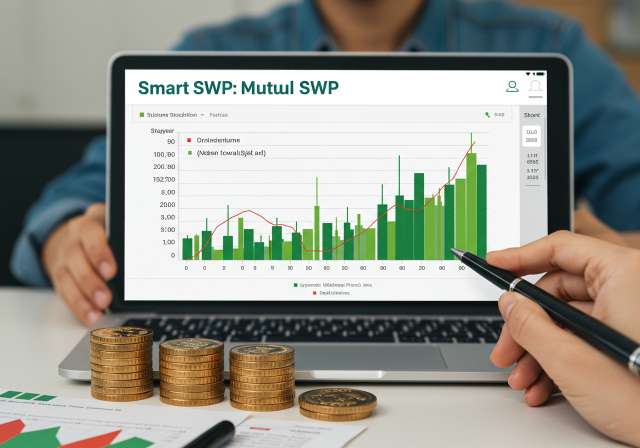
Numbers can sometimes be overwhelming, especially when dealing with investment data. This is where the SIP graph comes into play. A SIP graph is a visual representation of your SIP’s performance over time, typically plotting the investment amount against the market value. It provides a clear and intuitive way to understand the growth trajectory of your investments.
Instead of just looking at raw numbers and statements, the sip graph allows you to quickly grasp key insights, such as:
- The Overall Trend: Is your investment generally moving upwards? A consistently upward-sloping graph indicates healthy growth.
- Volatility: The steepness of the graph reflects market volatility. A graph with sharp peaks and valleys indicates higher volatility, while a smoother graph suggests lower volatility.
- Impact of Market Events: You can easily identify the impact of specific market events (e.g., economic downturns, political instability) on your investment by observing dips in the graph.
- Compounding Power: Over the long term, the power of compounding becomes evident in the SIP graph. You’ll see how your initial investments, combined with reinvested returns, lead to exponential growth.
Reading and Interpreting Your SIP Graph
Understanding the elements of a SIP graph is essential for effective analysis. Here’s a breakdown of the key components and how to interpret them:
Key Components of a SIP Graph:
- X-axis (Horizontal): Represents time (e.g., months, years).
- Y-axis (Vertical): Represents the value of your investment (typically in INR ₹).
- The Line: Shows the actual market value of your investment over time. This line will fluctuate based on market performance.
- Investment Amount: While not always explicitly shown, the cumulative investment amount is an important reference point. You can compare the market value to your total investment to see how much your investment has grown.
Interpreting the Graph:
- Upward Trend: A generally upward-sloping graph signifies positive returns. The steeper the slope, the faster your investment is growing.
- Downward Trend: A downward-sloping graph indicates negative returns. This usually happens during market corrections or downturns. Don’t panic! Remember that SIPs are designed for long-term investing, and market fluctuations are normal.
- Volatility: The jaggedness of the line reflects the level of volatility. A very jagged line indicates high volatility, while a smoother line suggests lower volatility. Your risk tolerance should align with the volatility of your chosen investment.
- Break-even Point: Identify the point where the market value line crosses your cumulative investment amount. This is your break-even point – the point at which you’ve recovered your initial investment.
Tools and Resources for Visualizing Your SIP
Many platforms and tools are available to help you visualize your SIP investments:
- Mutual Fund Company Websites: Most mutual fund companies provide online dashboards where you can track your investments and view SIP graphs.
- Online Investment Platforms: Platforms like Groww, Zerodha, and Upstox offer user-friendly interfaces with detailed SIP tracking and visualization tools.
- Financial Planning Software: Some financial planning software packages include features for tracking and visualizing investments, including SIPs.
- Spreadsheet Software (e.g., Microsoft Excel, Google Sheets): You can create your own SIP graph by manually entering your investment data into a spreadsheet and using the charting features.
Beyond the Graph: Making Informed Decisions
While the SIP graph provides valuable insights, it’s important to remember that it’s just one piece of the puzzle. Don’t rely solely on the graph to make investment decisions. Consider the following factors as well:
- Fund Performance: Analyze the fund’s historical performance relative to its benchmark and its peers. Look at metrics like Sharpe Ratio, Treynor Ratio, and Jensen’s Alpha to assess risk-adjusted returns.
- Expense Ratio: The expense ratio is the annual fee charged by the mutual fund to manage your investment. A lower expense ratio generally translates to higher returns for investors.
- Fund Manager Expertise: Research the fund manager’s experience and track record. A skilled and experienced fund manager can navigate market volatility and deliver consistent returns.
- Investment Goals and Risk Tolerance: Ensure that your SIP remains aligned with your financial goals and risk appetite. As your circumstances change, you might need to adjust your investment strategy.
- Market Conditions: Stay informed about market trends and economic developments. While you shouldn’t try to time the market, understanding the broader economic context can help you make more informed investment decisions.
SIP Strategies: Optimizing for Growth
Beyond simply investing a fixed amount each month, consider these strategies to potentially enhance your SIP returns:
- Step-Up SIP: Increase your SIP amount periodically (e.g., annually) to take advantage of rising income and the power of compounding. This is particularly effective when you receive salary increments.
- Trigger-Based SIP: Link your SIP investments to specific market triggers, such as a certain level of the NSE Nifty or BSE Sensex. This allows you to take advantage of market corrections and buy more units at lower prices.
- Switching Between Funds: If your chosen mutual fund is consistently underperforming, consider switching to a better-performing fund within the same asset class. This requires careful analysis and should be done strategically.
SIP vs. Other Investment Options in India
While SIPs offer a convenient and disciplined way to invest, it’s crucial to understand how they compare to other investment options available in India. Here’s a brief overview:
- Lumpsum Investments: Investing a large sum of money at once can potentially generate higher returns, but it also carries greater risk, especially if the market declines shortly after your investment.
- Public Provident Fund (PPF): A government-backed savings scheme offering guaranteed returns and tax benefits. PPF is a safe and reliable option, but the returns are typically lower than those of equity-based SIPs.
- National Pension System (NPS): A retirement savings scheme offering a mix of equity and debt investments. NPS provides tax benefits and can be a good option for long-term retirement planning.
- Equity Linked Savings Scheme (ELSS): Tax-saving mutual funds that invest primarily in equity. ELSS offers the potential for higher returns than traditional tax-saving options like PPF, but it also carries higher risk.
Conclusion: Harnessing the Power of SIPs for Financial Success
SIPs have emerged as a powerful tool for wealth creation in India, offering a disciplined and accessible way to participate in the equity markets. By understanding the concept of SIPs, tracking their performance using graphs and other metrics, and making informed investment decisions, you can harness the power of systematic investing to achieve your financial goals. Remember that long-term investing, patience, and a well-diversified portfolio are key to success in the dynamic world of Indian finance. Consult with a qualified financial advisor to create a personalized investment plan that aligns with your individual needs and circumstances.



Leave a Reply